




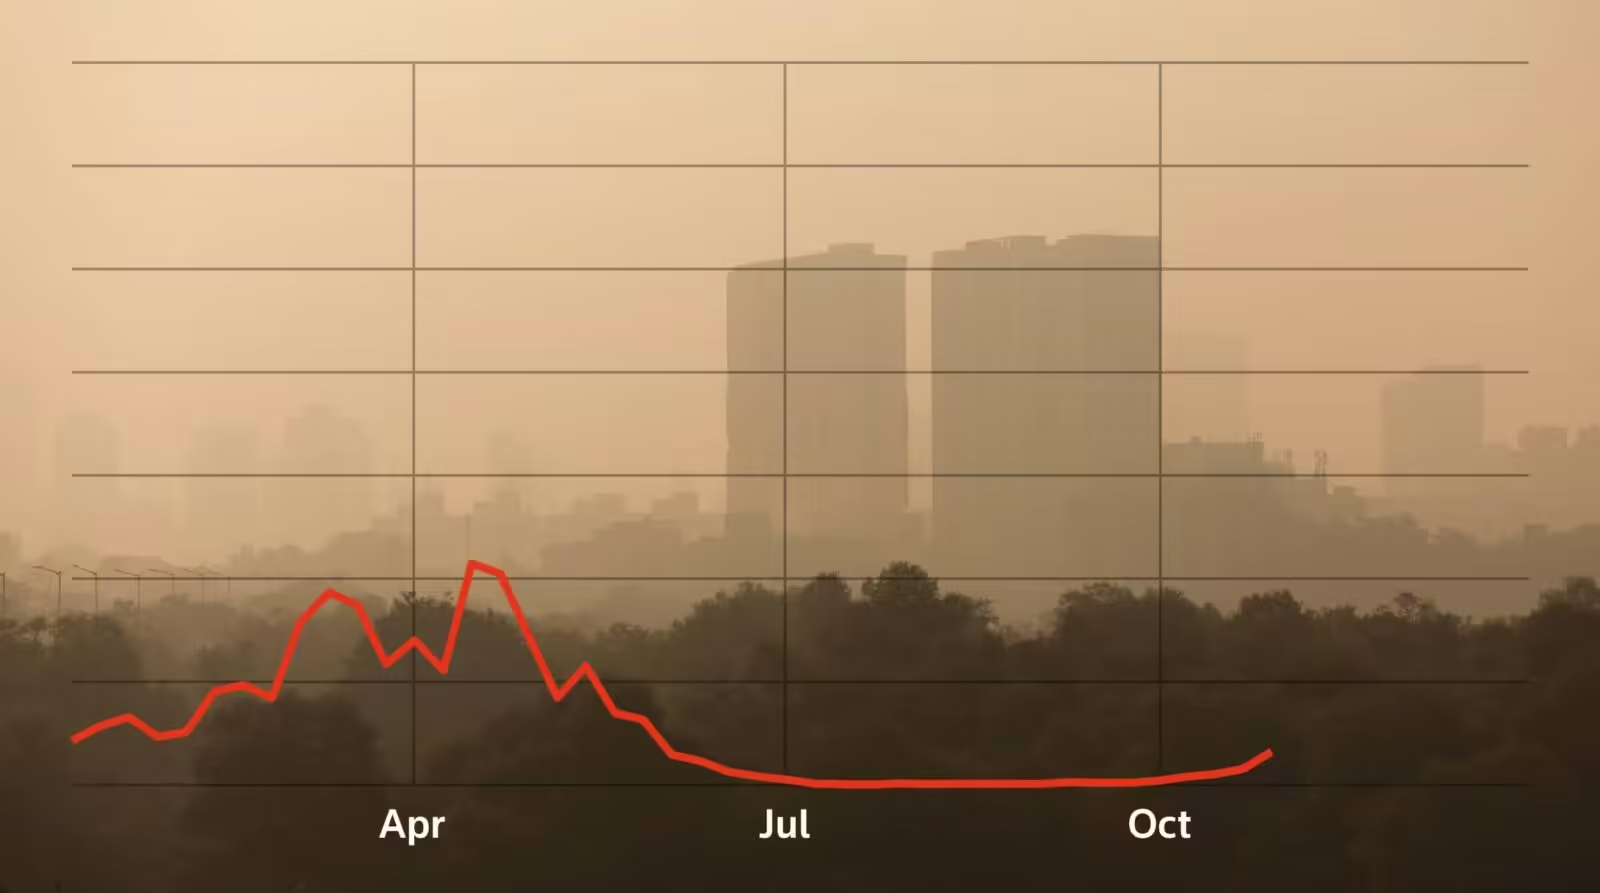

According to the latest data, satellites have detected fewer fire hotspots across the region than the historical average at this point in the year, although conditions vary widely by country.
India and Pakistan’s 2026 fire season, by the numbers
Every year, farmers in northern India and Pakistan burn crop stubble in two waves – generally peaking in April and November. The impacts of this are usually felt more intensely during the colder months, like November, due to the cold air trapping emissions, dust and smoke.
The government in the Indian capital Delhi announced measures to curb winter pollution in July 2026 from doubling car parking charges, staggering hours at government offices and a ban on outdoor civil construction other than essential public infrastructure. From Nov 1 to Jan 31, government and private offices must operate with half their staff in the office and the rest working from home, and violators face prosecution.
Previously curbs applied only when air quality fell below a set level under a graded action plan. They will now run continuously from Nov 1 to Feb 28, whatever the AQI reading.
Hotspots and thermal anomalies are counts of satellite pixels where a thermal anomaly was detected, not counts of fires. Each may be a wildfire, agricultural or crop-residue burning, or an industrial heat source, and detections are suppressed by cloud cover. Burnt area and emissions are near-real-time estimates, revised as later imagery is processed. Charts compare 2026 with the weekly average and range for 2012-2025, the period for which combined VIIRS and MODIS records exist. Fire danger is the weekly average of the Daily Severity Rating, an index of how difficult fires are to control based on weather conditions.
Fire hotspots, burnt area and fire danger from the Copernicus Global Wildfire Information System (GWIS/EFFIS), using NASA FIRMS detections from VIIRS and MODIS and ECMWF weather data; emissions from the Copernicus Atmosphere Monitoring Service Global Fire Assimilation System (CAMS GFAS); city air quality and aerosol optical depth from CAMS global atmospheric composition forecasts, via Open-Meteo
Rebecca Pazos, Raju Gopalakrishnan
Source: www.reuters.com