





Bonnie Ford votes at the De Borgia School in De Borgia, Mont., on Tuesday.
Tommy Martino/AP
hide caption
Tommy Martino/AP
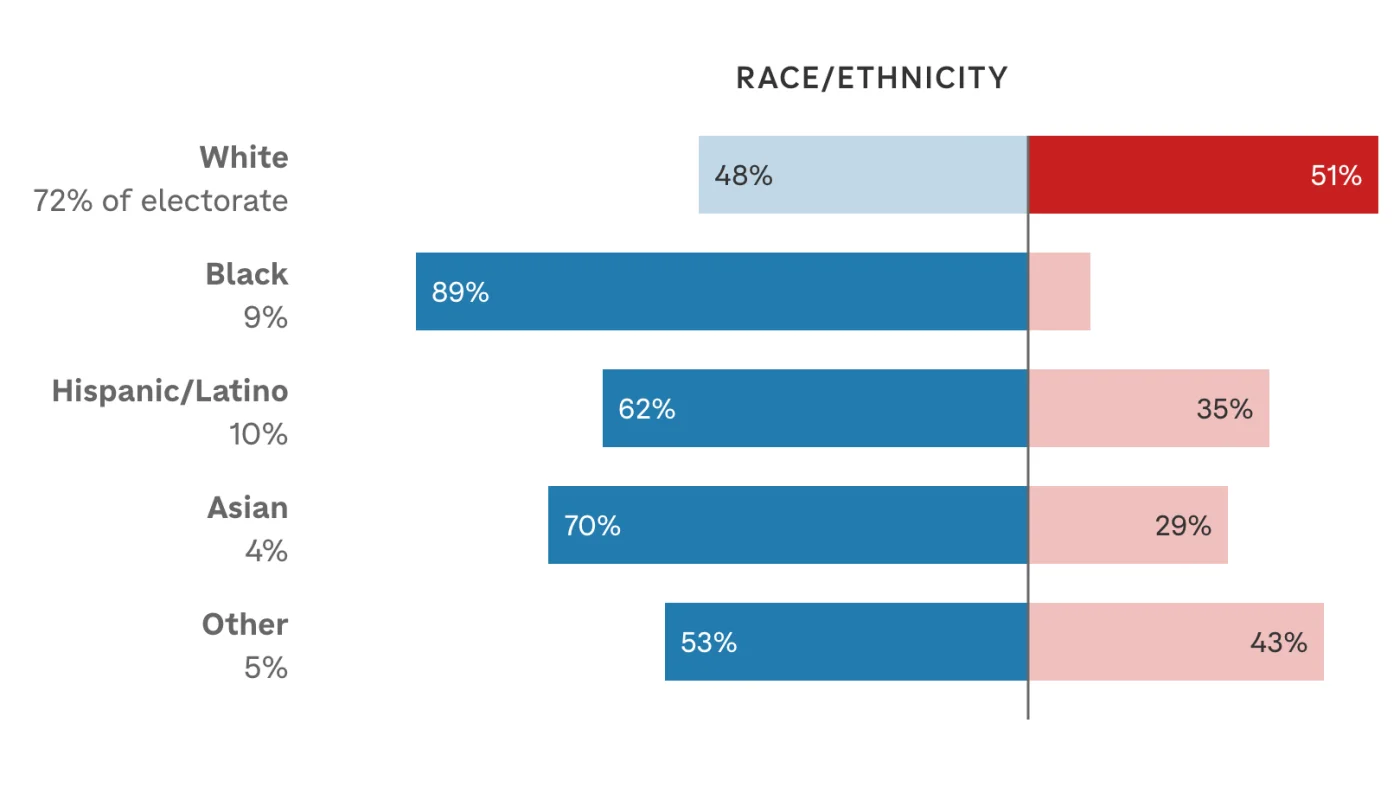
The charts below show how various demographic groups voted in the midterm elections. The data corresponds to the share of voters who said they voted for a House candidate of each party.
The data comes from a poll of tens of thousands of voters, conducted by the firm SSRS for a number of news outlets, including the Associated Press. The full sample has a margin of error of plus or minus 0.6 percentage points.
Source: www.npr.org