





Ethics declarations
The study protocol was approved by the ethics committees of all participating institutions, including the National Center for Global Health and Medicine (NCGM-S-004586), Tokyo Medical University Hospital (E2023-0026), University of Tokyo (No. 68-Multicenter), Hitachi Health Care Center (2021-33), the Institute of Health Sciences, Ezaki Glico (2023-23-240913) and RIKEN Center for Integrative Medical Sciences (2023-21). The study was conducted in accordance with the Declaration of Helsinki and relevant ethical guidelines. Written informed consent was obtained from all participants before enrollment. No financial compensation was provided to participants for participation in this study.
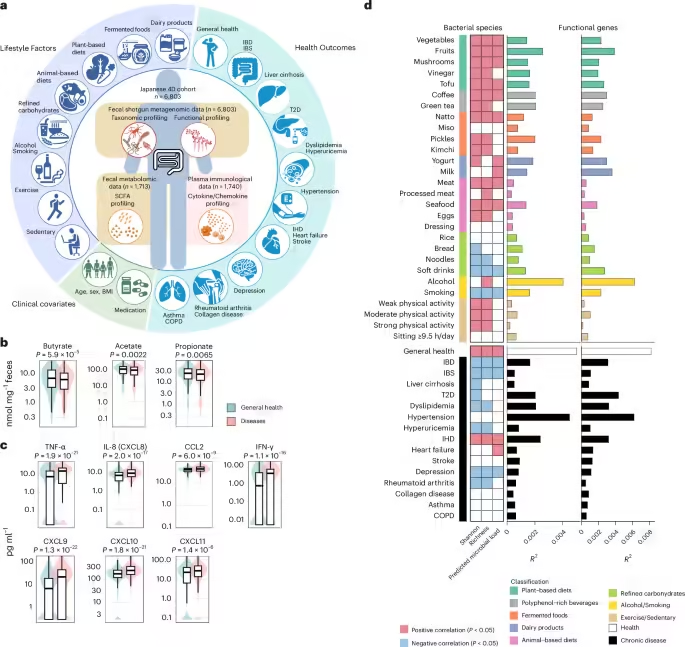
Japanese 4D Microbiome Project
The Japanese 4D Microbiome Project is a multicenter study involving hospitals, health screening centers and research institutes across Japan. Data and biospecimen collection began in January 2015 and is ongoing. Participants were recruited from individuals undergoing routine health check-ups or clinical evaluations. Clinical and lifestyle metadata were collected from both healthy and diseased individuals using standardized questionnaires, structured interviews and electronic medical records26. Stool samples were collected concurrently with metadata from all participants, and blood samples were obtained from individuals who provided additional consent.
Eligibility criteria included: (1) self-reported Japanese ethnicity and residence in Japan; (2) age ≥16 years, with no upper age limit; and (3) provision of written informed consent. Exclusion criteria included: (1) acute gastrointestinal bleeding; (2) conditions that precluded completion of questionnaires or informed consent; and (3) significant limitations in activities of daily living.
From the overall 4D cohort, 6,803 individuals with available fecal samples and corresponding metadata were included in the cross-sectional analysis (Extended Data Fig. 1). In addition, a longitudinal analysis was conducted in a subset of 402 individuals to evaluate intra-individual changes in the gut microbiome. These participants provided a total of 804 stool samples collected at two time points, with a median interval of 2.0 years between collections. Lifestyle information was assessed at both time points using standardized questionnaires, as described below.
Metadata collection and variables of interest
Participants completed a self-administered questionnaire covering lifestyle habits, medical history, comorbidities and medication use26. Research assistants subsequently reviewed the responses with each participant to correct inaccuracies and minimize missing data. Clinical information on physician-confirmed diagnoses and prescribed medications was additionally extracted from electronic medical records by trained staff.
In this study, modifiable lifestyle factors—including diet, alcohol consumption, smoking, physical activity and sedentary behavior—were considered the primary variables of interest, alongside health and disease status. Other variables, including age, sex, BMI and medication use, were treated as covariates. Diseases with fewer than 100 cases were excluded from the primary analysis. Medication use was not included as a primary variable but was considered in defining general health status and as a covariate in multivariable analyses. Sex was obtained primarily from medical records at the participating hospitals and healthcare institutions and supplemented by self-reported questionnaire data. Sex recorded in the medical records reflected the participant’s medically documented sex. Gender identity was not separately collected.
Assessment of lifestyle factors
Lifestyle factors, including dietary habits, alcohol consumption, smoking, physical activity and sedentary behavior, were assessed using a self-administered questionnaire. All lifestyle variables were assessed at the time of sample collection. Dietary habits and alcohol consumption over the past month were evaluated using a self-reported food frequency questionnaire, with items rated on a 7-point Likert scale (1, never or rarely; 2, one to three times per month; 3, one to three times per week; 4, four to six times per week; 5, once per day; 6, twice per day; and 7, three or more times per day)26. Dietary variables were further grouped into predefined categories (for example, plant-based diets, animal-based diets, fermented foods and refined carbohydrates). Alcohol consumption was further quantified by recording the amount consumed per occasion and frequency per week, from which weekly alcohol intake (grams per week) was calculated. Smoking status was defined based on current smoking behavior.
Physical activity was assessed using the International Physical Activity Questionnaire-Short Form (IPAQ-SF), a validated instrument for adult populations61. Activities were classified into three intensity levels: weak (for example, leisurely walking), moderate (for example, brisk walking, recreational cycling) and strong (for example, running, competitive sports). Prolonged sedentary behavior (sitting time) was defined as ≥9.5 h per day, a threshold associated with a marked increase in all-cause mortality risk in a non-linear dose–response relationship4.
Definition of general health and diagnosis of chronic disease
Individuals classified as having good general health (n = 2,119) were defined as those without comorbidities, a history of chronic diseases or surgery, medication use, or infection with hepatitis B virus, hepatitis C virus or HIV. To ensure a stringent definition of general health, medication use was assessed across 895 drug categories, and individuals reporting the use of any medication were not classified as having general health.
Self-reported diagnoses of chronic diseases have lower sensitivity compared with physician-confirmed diagnoses, which are considered the gold standard26. This discrepancy arises because some individuals may not report conditions they actually have and is particularly pronounced for heart failure, connective tissue disease and chronic obstructive pulmonary disease26. Therefore, to ensure diagnostic accuracy, physician-confirmed diagnoses were primarily used in this study. The diagnoses of chronic diseases were based on typical clinical symptoms and supported by findings from endoscopic examinations, histopathological analyses, imaging studies (computed tomography, magnetic resonance imaging or ultrasound), and blood tests. All diagnostic data were obtained from electronic medical records at each participating institution. For example, IBD was diagnosed based on endoscopic findings and biopsy results, with infectious enterocolitis excluded through negative culture tests and clinical courses. In contrast, IBS was diagnosed using self-reported questionnaires based on the Rome IV criteria.
Assessment of medication use
Medication use was assessed by trained research staff through review of self-administered questionnaires, electronic medical records, and medication history notebooks (‘Okusuri Techo’), which are maintained by pharmacists to document prescription details26. Medication use was defined as the use of any oral or self-administered injectable drugs within the past month, and this definition was applied consistently across all analyses. All medications were categorized according to the World Health Organization Anatomical Therapeutic Chemical (ATC) Classification System.
Confounding factors
To control for potential confounding, all association analyses between host-related variables (including lifestyle factors and clinical outcomes), gut microbiome features and microbiome-based scores were adjusted for a predefined set of covariates. These covariates were selected based on known factors associated with both host-related variables and the gut microbiome and comprised eight covariates: age, sex, BMI and five medication-use variables. Medication use was defined as the use of drugs known to substantially influence the gut microbiome26, including proton pump inhibitors, antibiotics, statins, antidiabetic drugs (metformin) and antihypertensive agents (angiotensin II receptor blockers).
To ensure model stability, the number of covariates included in multivariable models was restricted according to the 10 events-per-variable rule62. Based on the minimum number of outcome events (≥100 cases), the number of covariates was limited to a maximum of 10, and eight covariates were included. Although moderate correlations were observed for a small number of exposure pairs (for example, vegetables and mushrooms, vinegar and mushrooms), most exposure pairs showed weak correlations (Spearman’s rho < 0.4; Supplementary Table 2). Therefore, to minimize multicollinearity and improve interpretability of exposure–microbiome associations, lifestyle variables were analyzed individually.
Analyses involving host metadata, including microbial diversity analyses, MaAsLin2 models and mediation analyses, were adjusted for eight covariates. In contrast, correlation analyses between bacterial species and functional features (KOs, SCFAs and cytokines) were conducted without covariate adjustment, as these analyses were exploratory and aimed at characterizing inter-omic relationships.
Fecal sample collection
Fecal samples were collected at home by participants and submitted to the study institutions on the same day whenever possible. If same-day submission was not feasible, samples were stored in a refrigerator and delivered within 2 days26. Because bowel-cleansing agents used for colonoscopy preparation are known to substantially alter the gut microbiome and metabolome63, samples collected within 1 month after their use were excluded from analysis. Each participant was provided with three fecal collection tubes: one containing Cary–Blair medium (Toyobo) and two without preservatives26. Samples preserved in Cary–Blair medium were used for gut microbiome analysis, as this medium stabilizes microbial composition for 16S rRNA-based profiling and is suitable for bacterial isolation64. In contrast, samples without preservatives were used for metabolomic analysis. Study staff verified that sufficient stool volume was obtained for analysis26. All samples were immediately stored at −80 °C upon arrival at the institution and kept frozen until DNA extraction.
Extraction of microbial DNA and sequencing
Microbial DNA was extracted using an enzymatic lysis method with lysozyme (Sigma-Aldrich) and achromopeptidase (Wako)26. The extracted DNA was treated with RNase A (Wako) and purified by precipitation with a 20% PEG solution (PEG6000 in 2.5 M NaCl). The DNA was then pelleted by centrifugation, washed twice with 75% ethanol and dissolved in TE buffer. Library preparation was carried out using the NEBNext Ultra II DNA Library Prep Kit for Illumina (New England BioLabs), following the manufacturer’s protocol. Paired-end sequencing (151 bp × 2) was performed on a HiSeq X platform (Illumina) at Genewiz Japan26.
Taxonomic and functional profile of the bacteriome
Taxonomic profiles at the species level were obtained using the mOTUs v3.0.1 profiler, excluding unassigned mOTUs from further analysis. Taxonomic assignments were performed using the Genome Taxonomy Database (GTDB)65 based on the provided mOTUs–GTDB mapping file, and all downstream analyses were conducted using this GTDB-based taxonomy. The same mOTUs v3.0.1 pipeline was applied to both baseline and longitudinal follow-up metagenomic samples. Correspondence between GTDB-based species and NCBI taxonomy is provided in supplementary tables and source data tables.
For functional profiling of the bacteriome, metagenomic reads were mapped to a previously constructed non-redundant gene set (n = 9,901,170)26 using Bowtie2 with a minimum sequence identity of 95%, and read counts were obtained for each gene. Functional profiles were assessed at the KEGG orthology level, annotated using eggNOG-mapper (v1.0.3) with the eggNOG database (v4.5).
Definition of oral bacteria detected in the gut
Oral-derived bacteria detected in the gut were defined based on oral microbiome data from a previous study37. Bacterial species with an average relative abundance ≥0.1% and a detection rate ≥10% in oral samples were defined as oral-derived species.
Definition of gut pathobionts
Gut pathobionts were defined as bacterial species with reported pathogenic potential in clinical settings, together with representative species belonging to bacterial groups included in the World Health Organization priority list of antibiotic-resistant pathogens66. Representative pathobiont taxa included Enterococcus spp. (E. faecalis, E. faecium, E. raffinosus and E. avium), Streptococcus intermedius, S. constellatus, S. anginosus, S. mutans, S. gordonii, Peptostreptococcus stomatis, Rothia mucilaginosa, R. dentocariosa, Morganella morganii, Eggerthella lenta, Clostridium innocuum, Clostridium perfringens, Fusobacterium mortiferum, Hungatella hathewayi, Bacteroides fragilis, Desulfovibrio desulfuricans, Ruminococcus gnavus and Enterococcus gallinarum. In addition, we included representative species from the World Health Organization priority list of antibiotic-resistant pathogens66, such as E. coli, Enterococcus faecium, Staphylococcus aureus and Klebsiella pneumoniae.
Fecal SCFA profiling
For fecal SCFA extraction, 25 μl fecal methanol extract was mixed with 10 μl Milli-Q water containing internal standards (2 mM [1,2-13C2] acetate, 2 mM [2H7] butyrate, and 2 mM crotonate), centrifugally concentrated at 40 °C and reconstituted in 100 μl Milli-Q water67,68. Subsequently, 50 μl hydrochloric acid and 200 μl diethyl ether were added and mixed thoroughly. After centrifugation at 3,000 × g for 10 min, 80 μl of the organic layer was transferred to a glass vial, and 16 μl N-tert-butyldimethylsilyl-N-trifluoroacetamide (MTBSTFA; Sigma-Aldrich) was added for derivatization67,68. Samples were incubated at 80 °C for 20 min and allowed to stand for 48 h before injection67,68. SCFAs were analyzed using a Shimadzu GCMS-TQ8030 triple-quadrupole mass spectrometer equipped with a BPX5 capillary column67,68. The gas chromatography oven temperature was held at 60 °C for 3 min, increased to 130 °C at 8 °C min⁻1, then increased to 330 °C at 30 °C min⁻1 and held at 330 °C for 3 min. The detector and injector temperatures were 230 °C and 250 °C, respectively67,68. Gas chromatography was operated in constant linear velocity mode at 40 cm s⁻1. The injection volume was 1 μl with a split ratio of 1:30. Spectral data were processed using LabSolutions Insight software (version 3.8.0, Shimadzu), and SCFA concentrations were quantified using calibration curves67,68. Differences in SCFA concentrations between individuals with and without good general health were assessed using the Wilcoxon rank-sum test.
Plasma cytokine and chemokine profiling
To minimize biological variability, plasma samples were collected within one week of fecal sample collection. Plasma cytokines were measured in participants from the cohort who provided consent for blood sampling (n = 1,740). Cytokine and chemokine concentrations were quantified using the Bio-Plex 3D system (Bio-Rad) and the HISCL-5000 immunoassay system (Sysmex), according to the manufacturers’ standard protocols69. The cytokines and chemokines analyzed were selected based on established immunological framework and prior knowledge of microbiome–immune interactions, representing two predefined inflammatory programs70,71. Specifically, markers reflecting innate immune inflammatory responses (tumor necrosis factor α, interleukin-8 and CCL2) and markers reflecting Th1/IFN responses (IFN-γ and the CXCR3 ligands CXCL9, CXCL10 and CXCL11) were included. The former represent early inflammatory cytokine and chemokine activation, whereas the latter reflect IFN-γ-driven immune signaling pathways70,71. As an initial analysis, differences in cytokine and chemokine concentrations between individuals with and without good general health were assessed using the Wilcoxon rank-sum test. Subsequently, correlations between gut microbial species-level relative abundances (mOTUs) and plasma cytokine and chemokine concentrations were evaluated using Spearman’s rank correlation analysis.
Data preprocessing for statistical analyses
Unless otherwise specified, all microbiome analyses were performed using relative abundance profiles of gut microbial features (mOTUs and KOs). Microbial features with a prevalence of <2.5% within the 4D cohort were excluded before all statistical analyses. Relative abundance profiles were used directly for analyses of α-diversity, predicted microbial load, Bray–Curtis β-diversity and Spearman correlation analyses without additional transformation. For MaAsLin2, mediation analyses and linear mixed-effects models, relative abundance values were log-transformed after replacing zero values with half of the minimum non-zero value. Preprocessing for LASSO analyses is described separately below.
Assessment of microbial diversity and predicted microbial load
The Shannon diversity index was calculated at multiple levels of the gut microbiome, including taxonomic (bacteriome) and functional gene profiles, using the diversity function from the vegan R package (version 4.4.1). Associations between α-diversity metrics (richness and Shannon index), predicted microbial load, and host metadata, including lifestyle factors and health and disease outcomes, were assessed using partial Spearman’s rank correlation analysis implemented with the pcor.test function in the ppcor R package (version 1.0). All analyses were adjusted for sequencing read depth together with the eight covariates described above.
To evaluate microbial community composition, Bray–Curtis dissimilarity was calculated from relative abundance profiles of gut microbial features (mOTUs and KOs). Associations between Bray–Curtis distances and host metadata were analyzed using permutational multivariate analysis of variance (PERMANOVA), implemented via the adonis2 function in the vegan package with 999 permutations, adjusting for sequencing read depth together with the same covariates described above. This approach allowed estimation of the proportion of variance in community composition explained by lifestyle factors and health and disease outcomes. PERMANOVA R2 values were used to quantify the variance attributable to individual variables of interest.
Predicted microbial load of fecal samples was estimated using the Microbial Load Predictor tool (https://microbiome-tools.embl.de/mlp/).
Multivariable association analysis between gut microbiome features and host metadata
To identify associations between the relative abundance of microbial features (for example, mOTUs and KOs) and lifestyle factors, as well as health or disease status, we employed the MaAsLin2 R package (version 1.14-1) using a linear model with fixed effects. Effect sizes were reported as coefficient values, and models were adjusted for covariates as described above. A minimum prevalence threshold of 2.5% (prevalence ≥0.025) was applied to include microbial features in the analysis. This threshold was selected to retain low-prevalence but biologically relevant microbial features potentially associated with lifestyle factors, including fermentation-associated taxa involved in traditional foods such as natto and kimchi, for example Bacillus subtilis (prevalence = 0.084) and Lactobacillus sakei (0.042). Multiple testing correction was performed separately for each lifestyle factor using the Benjamini–Hochberg method to control the FDR.
KEGG pathway enrichment analysis
To identify microbial functional pathways associated with lifestyle factors, general health, and 15 chronic diseases, KOs significantly associated with host metadata were first identified using MaAsLin2 (FDR < 0.1; Supplementary Table 5). These KOs were subsequently subjected to KEGG pathway enrichment analysis using the enrichKEGG function in the clusterProfiler R package (version 4.12.6). Pathways with a FDR < 0.05 were considered statistically significant. Gene ratio, background ratio, rich factor (defined as the ratio of KOs mapped to a pathway to the total number of KOs in that pathway), KEGG ID, and gene counts were calculated and are provided in Supplementary Table 9.
Mediation analysis
We performed mediation analysis based on the potential outcomes framework27,72, which enables decomposition of total effects into direct and indirect components under a counterfactual framework.
To investigate whether gut microbial features (mOTUs, KOs and modules) mediate the relationship between lifestyle factors and health outcomes, mediation analyses were conducted using the R package mediation (version 4.5.0)72. Lifestyle factors (for example, dietary factors) were treated as exposures, gut microbial features as mediators and general health status and 15 chronic diseases as outcomes. The eight covariates described above were included in all models. To address zero values in relative abundance data before log transformation, zeros were replaced with half of the minimum non-zero value. To mitigate the potential for reverse causation, reverse mediation analyses were additionally performed32, in which lifestyle variables were treated as exposures, health status and disease outcomes as mediators and gut microbial features as outcomes. Microbial mediators included for the analysis were preselected based on associations between microbial features and lifestyle factors as well as health or disease outcomes using MaAsLin2. In this screening step, a more permissive threshold (FDR < 0.1) was applied to minimize type II error (false negatives) at the candidate selection stage and retain weak associations that may be overlooked due to the inherent characteristics of microbiome data.
Mediation analyses were conducted using the following models: (1) mediator models, microbial feature ~ lifestyle + covariates; and (2) outcome models, health status or disease outcome ~ microbial feature + lifestyle + covariates. For reverse mediation analyses, (1) mediator models, health status or disease outcome ~ lifestyle + covariates; and (2) outcome models, microbial feature ~ health status or disease outcome + lifestyle + covariates, were applied. Linear or logistic regression models were used depending on the type of outcome variable27,72,73.
The indirect effect represents the mediated effect of the exposure on the outcome through the microbial feature27,72,73. Statistical significance was evaluated using a nonparametric bootstrap procedure with 1,000 resamples. Multiple testing correction was performed using the Benjamini–Hochberg method to control the FDR. Mediation effects were considered statistically significant only when both criteria were satisfied: (1) a significant indirect effect in the forward mediation analysis (FDR < 0.05), and (2) no significant indirect effect in the reverse mediation analysis (P ≥ 0.05).
Significant mediation relationships among microbial features, lifestyle factors and health outcomes were visualized using Sankey diagrams implemented in the R packages networkD3 (version 0.4.1) and diagrams. The links in the Sankey diagrams were colored according to the direction and magnitude of associations derived from MaAsLin2 analyses, with colors determined based on the corresponding regression coefficients.
Definition of health- and disease-oriented mediators
To characterize the biological properties of microbial species mediating the associations between lifestyle factors and health or disease outcomes, we defined health-oriented and disease-oriented mediators based on mediation directionality and association patterns with outcomes. Health-oriented mediators were defined as microbial species satisfying all of the following criteria: (i) exhibiting a significant indirect effect in at least one lifestyle–microbe–general health mediation pathway (FDR for forward mediation < 0.05 and P for reverse mediation ≥ 0.05); (ii) showing a positive association with general health (β > 0, FDR < 0.1; MaAsLin2); and (iii) showing a negative association with at least one disease outcome (β < 0, FDR < 0.1; MaAsLin2). Disease-oriented mediators were defined as microbial species satisfying all of the following criteria: (i) exhibiting significant mediation effects in at least two distinct lifestyle–microbe–disease pathways (FDR for forward mediation < 0.05 and P for reverse mediation ≥ 0.05); (ii) showing positive associations with the corresponding disease outcomes (β > 0, FDR < 0.1; MaAsLin2); and (iii) not showing a significant positive association with general health (β > 0, FDR < 0.1; MaAsLin2). This classification was designed to distinguish microbial features associated with beneficial versus detrimental host outcomes.
Validation of mediation analysis using external cohorts
To evaluate the robustness of bacterial mediation effects identified in the Japanese 4D cohort, we utilized external metagenomic and dietary data from a cohort outside Japan. The US IBD study (age ≥16 years, n = 379)20 was selected as the only available cohort with dietary, clinical outcome, and metagenomic data. Among these, 374 individuals with complete lifestyle data were included in the analysis. Mediation analyses were conducted in both the Japanese and US cohorts, with dietary habits as exposures, bacterial species as mediators and IBD as the outcome. Due to missing BMI data in the US cohort, models were adjusted for age and sex as covariates. No prevalence threshold was applied to maximize the overlap of microbial features between cohorts. We focused on dietary factors common to both Japanese and US populations, including legumes, vegetables, milk, yogurt, fruits and coffee. To assess cross-cohort consistency, we evaluated the concordance of species-level indirect effects mediating the association between dietary habits and IBD risk using Spearman’s rank correlation analysis.
Correlation analyses among bacterial species, SCFAs, cytokines and functional profiles
To characterize microbial taxa mediating the associations between lifestyle factors and health or disease outcomes, correlations between species-level relative abundance (mOTUs) and fecal SCFAs as well as plasma cytokine concentrations were evaluated. To further investigate functional relationships, correlations between significant bacterial mediators and significant KO mediators were assessed using their relative abundances. In addition, correlations between microbial predictive scores derived from LASSO models (as described below) for each health and disease outcome and SCFA and cytokine levels were evaluated. All correlation analyses were performed using Spearman’s rank correlation coefficient. These analyses were exploratory and focused on inter-omic relationships; therefore, adjustment for host covariates was not applied.
Intra-individual longitudinal analysis
To assess the robustness of lifestyle–gut microbiome associations identified in the cross-sectional inter-individual analysis (n = 6,803), we conducted an intra-individual analysis using longitudinal data from a subset of 402 participants from the same cohort. Paired fecal samples were collected at two time points with a median interval of 2.0 years. Longitudinal associations between lifestyle factors and microbial features were evaluated using linear mixed-effects models with participant-specific random intercepts to account for within-individual correlations. Lifestyle factors, including dietary scores, alcohol intake, physical activity duration, and smoking status, were treated as time-varying fixed effects. Baseline microbial abundance, baseline lifestyle exposure, and time point were included as fixed-effect covariates. Model coefficients were estimated using all available longitudinal observations, and standardized effect sizes were reported to facilitate comparison across lifestyle factors. Owing to the limited sample size for each lifestyle factor, a P value < 0.05 was considered statistically significant.
Sensitivity analyses
To evaluate the robustness of the mediation analyses, we performed two complementary sensitivity analyses. First, to assess the potential influence of correlated lifestyle behaviors, we repeated the mediation analyses using six additional sensitivity models with sequential adjustment for major lifestyle factors. Model 2 additionally adjusted for healthy dietary factors (vegetables, fruits and natto), model 3 for unhealthy dietary factors (soft drinks), model 4 for physical activity, model 5 for sedentary behavior, model 6 for alcohol consumption and smoking and model 7 for all major lifestyle factors simultaneously. Using the same significance criteria as the primary analysis (forward mediation: FDR < 0.05; reverse mediation: P ≥ 0.05), indirect effect sizes for mediation pairs identified as significant in the primary analysis were compared with those estimated in each sensitivity model using Spearman’s rank correlation.
Second, to evaluate the potential influence of differences in disease case numbers on mediation analyses, we first examined the association between disease case numbers and the number of significant mediation pairs across diseases using Spearman’s rank correlation. We then performed case-number-matched sensitivity analyses by reducing disease cases to the smallest disease cohort (n = 134) while preserving the distributions of age, sex, BMI and medication use using stratified random subsampling. This procedure was repeated ten times for each disease. For all mediation pairs evaluated in the primary analysis, concordance between the original and each subsampled analysis was assessed using Spearman’s rank correlation of indirect effect sizes and the proportion of concordant mediation directions.
Microbiome-based prediction score construction using LASSO
To develop microbiome-based prediction scores for general health and 15 chronic diseases, we applied LASSO-penalized logistic regression to mOTU-level taxonomic profiles generated using the mOTUs v3.0.1 pipeline from fecal shotgun metagenomes. Features with low prevalence (<2.5%), consistent with the filtering criteria used in the association analyses, were excluded before outcome-specific cross-validation. To avoid information leakage during nested tenfold cross-validation, within each outer training fold, zero values were replaced with a pseudocount defined as half of the minimum non-zero value observed in the corresponding training data, followed by centered log-ratio transformation. Feature standardization (zero mean and unit variance) was performed using the mean and standard deviation estimated from the corresponding outer training fold, and the same transformation parameters were applied unchanged to the corresponding outer test fold. Unless otherwise specified, all analyses were conducted in R using the glmnet package (version 4.1-10).
For each outcome (general health and each disease), LASSO-penalized logistic regression models were fitted to derive microbiome-based prediction scores using microbial features as predictors and the binary outcome as the response. The penalty parameter was selected using stratified tenfold cross-validation with the 1-standard-error rule (λ1se) to obtain parsimonious and robust models. This approach enables the derivation of microbiome-based risk scores for individual-level assessment and cross-cohort application, consistent with prior microbiome risk scoring frameworks21. For each individual, a microbiome-derived prediction score was calculated as the linear predictor (log-odds) from the fitted model19, representing the weighted sum of selected microbial features, where higher scores indicate a microbial profile more strongly associated with the case class. These prediction scores were defined as MADE scores. Features with non-zero coefficients were regarded as LASSO-selected microbial features contributing to the prediction score.
The discriminatory ability of the MADE scores was assessed using the area under the receiver operating characteristic (AUC) curve. To obtain internally validated performance estimates in the main Japanese cohort, we applied a nested tenfold cross-validation framework. For each outcome, model performance was evaluated using an outer stratified tenfold cross-validation, whereas the LASSO model was trained within each training fold according to the procedure described above. Briefly, the regularization parameter (λ1se) was selected by an inner stratified tenfold cross-validation using the ‘cv.glmnet‘ function from the glmnet package (version 4.1.10). Stratified folds were generated using the ‘createFolds‘ function from the caret package (version 7.0.1). In each outer fold, the trained LASSO model was applied to the corresponding held-out samples, such that each individual received a prediction score from a model that had not been trained using that individual. Out-of-fold predictions generated from the outer cross-validation folds were pooled to calculate cross-validated test AUCs using the pROC package (version 1.19.0.1). In addition to the microbiome-based (MADE) model, three prediction models were evaluated using the same nested tenfold cross-validation framework: a Host model only (age, sex, BMI and 28 lifestyle factors), a MADE model only and a combined Host model + MADE. Pairwise comparisons of AUCs were performed using DeLong’s test. For visualization, score distributions between case and control groups were compared using violin plots, and group differences were assessed using the Wilcoxon rank-sum test. AUC values are reported in the corresponding figures.
Enrichment analysis of mediator species among LASSO-selected features
To assess whether microbial species selected by LASSO prediction models were more likely to be identified as mediators in mediation analysis, we performed an enrichment analysis based on 2 × 2 contingency tables. Taxa were classified according to LASSO selection (selected vs nonselected) and mediation significance (significant vs nonsignificant). ORs were calculated as (a/b)/(c/d), where a and b denote the numbers of mediation-significant and nonsignificant species among LASSO-selected taxa, respectively, and c and d denote those among nonselected taxa. The proportion of mediation-significant taxa among LASSO-selected species was calculated as a/(a + b). When zero counts were present in any cell, a continuity correction of 0.5 was added to all cells (Haldane–Anscombe correction) to enable stable estimation of the OR. Statistical significance was assessed using Fisher’s exact test, and 95% confidence intervals for the ORs were estimated. The counts corresponding to each cell of the contingency table (a, b, c and d) are provided in the source data table to ensure transparency and reproducibility. All analyses were restricted to microbial species included in the LASSO modeling framework (minimum prevalence ≥0.025).
External validation of MADE scores in independent non-Japanese cohorts
To evaluate the reproducibility and generalizability of microbiome-based predictive signatures, we applied the LASSO models derived from the Japanese 4D cohort to publicly available external shotgun metagenomic datasets from 13 independent non-Japanese cohorts (total n = 3,095; age ≥16 years). The external datasets included IBD from Franzosa et al. (USA; n = 218)74, Crohn’s disease from He et al. (China; n = 107)75, and IBD from Lloyd-Price et al. (USA; n = 374)20; IBS from Mars et al. (USA; n = 448)76; liver cirrhosis from Qin et al. (China; n = 164)77; chronic liver disease from Odenwald et al. (USA; n = 435)78; T2D from Karlsson et al. (Sweden; n = 96)79 and Qin et al. (China; n = 366)80; hypertension from Li et al. (China; n = 140)81; ischemic heart disease from Jie et al. (China; n = 385)82; depression from Kovtun et al. (Russia; n = 73)83; rheumatoid arthritis from Zhang et al. (China; n = 232)84; and chronic obstructive pulmonary disease from Bowerman et al. (Australia; n = 57)85. For general health, control individuals from all external cohorts were pooled and treated as the healthy group (n = 1,067).
Microbial features were harmonized at the species level, and only species shared between the Japanese 4D cohort and each external dataset were retained for score calculation. External microbial profiles were preprocessed using the same centered log-ratio transformation and feature standardization procedures as described previously before model application. For each individual, MADE scores were calculated as the linear predictors (log-odds) obtained by directly applying the previously trained LASSO models from the Japanese 4D cohort without model refitting. The discriminatory performance of MADE scores was evaluated by calculating the AUC within each cohort. Differences in MADE score distributions between case and control groups were assessed using the Wilcoxon rank-sum test.
Statistical criteria for significance and covariate adjustment
Given the large number of association and mediation analyses performed in this study, we applied analysis-specific statistical criteria to balance false discovery control and statistical power. For mediation analyses, statistical significance was defined as FDR < 0.05, and the same threshold was consistently applied to the primary association analyses between microbial features and lifestyle or health-related variables. For the selection of candidate microbial mediators, a more relaxed threshold (FDR < 0.1) was applied in the initial association screening, as described above, to allow inclusion of potential mediators. Mediator species were then defined based on predefined criteria integrating forward and reverse mediation analyses, as described above.
For analyses involving microbial diversity and metadata, as well as associations between bacterial species and functional or host-related features (KOs, SCFAs and cytokines), and associations between LASSO-derived microbial scores and metadata or host factors, statistical significance was defined as P < 0.05 to prioritize sensitivity in hypothesis-generating analyses. Corresponding FDR values were also calculated and reported in the figures and tables as reference.
Eight predefined covariates (age, sex, BMI and five medication-use variables) were included in all association analyses involving lifestyle factors and health/disease outcomes to control for confounding. In contrast, covariate adjustment was not applied to analyses that did not involve host metadata (for example, associations between bacterial species and microbial functional features or metabolites), as these analyses were intended to characterize intrinsic microbiome relationships independent of host-related confounders.
Reporting summary
Further information on research design is available in the Nature Portfolio Reporting Summary linked to this article.
Source: www.nature.com