





Ethics
This modelling study used only published aggregated data and was not reviewed by an ethics committee.
Research design
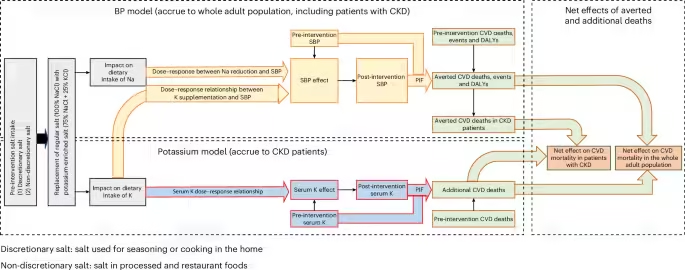
This study used a comparative risk assessment framework adapted from our prior modelling studies11,12. The model first estimated the impact of strategies for replacing regular salt with potassium-enriched salt on dietary sodium and potassium intake for each country. The impact of an increase in dietary potassium intake was assumed to be derived only from replacement of regular salt with potassium-enriched salt, incorporating the proportion of sodium intake from discretionary salt versus other sources of sodium that are non-discretionary for each country. For every intervention scenario, the composition of the potassium-enriched salt was fixed as 75% sodium chloride and 25% potassium chloride because this is the ratio for which there is best evidence of clinical benefits and acceptability8. Based on the effects on dietary sodium and potassium intake, the model projected the impact on SBP and the subsequent effect of SBP change on the risks of CVD and CKD. In addition, the model estimated the increase in serum potassium among people with CKD stages G3–5 (estimated glomerular filtration rate (eGFR) <60) and the potential number of cardiovascular deaths caused by hyperkalaemia in this group.
Participants
For each of the 193 countries and territories, the adult population (aged 25+ years) was divided into 5-year age intervals from 25–29 to 90–94 years, with an additional group of 95+ years. Younger age groups were not included owing to their much lower burden of CVD and CKD, limited data on sodium and potassium intake, and sparse data describing the effects of sodium and potassium on SBP and risks of CVD and CKD in this group. The analyses were done separately for women and men and then combined.
Intervention scenarios
We estimated the impact of a switch to potassium-enriched salt under five scenarios: (1) worldwide replacement of all salt (including both discretionary salt and non-discretionary salt; (2) worldwide replacement of just discretionary salt; (3) worldwide replacement of just non-discretionary salt; (4) worldwide replacement of discretionary salt just for people diagnosed with hypertension (whether treated or not); and (5) worldwide replacement of discretionary salt just for people treated for hypertension (Extended Data Table 2).
For every scenario, we modelled the potential benefits mediated through SBP lowering. For the first three scenarios, we also modelled the potential harms mediated through hyperkalaemia among people with CKD stages G3–5. For scenarios (4) and (5), we modelled only the potential benefits on the assumption that clinical decision-making would prevent use of potassium-enriched salt amongst people with CKD stages G3–5. For these model estimates, we assumed arbitrarily that 20% of people under each scenario would not be recommended to use potassium-enriched salt owing to concerns about hyperkalaemia. The prevalence of CKD stages G3–5 among US adults with hypertension was 8.9% in 2015 to 201825, so the assumed 20% untreated is deemed conservative.
Data sources and key model assumptions
Supplementary Table 1 lists key model inputs. For pre-intervention mean sodium intake, we used country-specific estimates from the 2021 GBD study. Country-specific estimates of dietary sources of sodium (discretionary versus non-discretionary) were derived from a linear regression based on gross domestic product17 updated by substituting the 2010 World Bank gross domestic product figures used in the original report with 2021 data from the World Bank or the International Monetary Fund if data from the World Bank was not available.
For BP inputs to the model, we used country-, age- and sex-specific estimates and standard deviations of SBP from the 2021 GBD study. Corresponding hypertension prevalence estimates and the proportions treated were extracted from the 2019 Non-Communicable Disease Risk Factor Collaboration26. To estimate the effect of sodium reduction on SBP, we used linear dose–response relationships from a meta-regression of trials27 that enabled us to calculate the change in SBP achieved for a given sodium reduction, in a given age group, separately for individuals with and without hypertension. Dose–response data from salt substitute trials were not used because there were insufficient studies, and different compositions of potassium-enriched salt were used, which made it difficult to quantify the dose–response. In line with the WHO recommendation for maximum daily intake of 2 g of sodium per day, no additional effect on SBP was modelled for reductions below this level. To estimate the effect of increased potassium intake on SBP, we used data from a meta-analysis of randomized controlled trials28. Dose–response effects for potassium intake on SBP varied by baseline sodium intake level with stronger relationships and greater maximum achievable SBP falls in those with higher baseline sodium consumption28 (Supplementary Text 1). The effects of sodium reduction and increased potassium intake on SBP derived from these two estimation processes were assumed to be additive.
We used 2021 GBD Study country-, age- and sex-specific estimates for current CVD and CKD burden14. The associations of SBP changes with the risks of each type of CVD and CKD were based on the 2019 GBD Study29. The theoretical minimum risk exposure level for SBP was 110–115 mm Hg for each outcome, and no additional protective effect on CVD or CKD risk was modelled for SBP falling below this level.
For modelling potential harms of hyperkalaemia-related mortality, we used data on the prevalence of each stage of CKD (G3–5) for country-, age- and sex-specific population groups obtained from the 2021 GBD Study group, supplemented with data from a further study that enabled separate estimates to be made for stage G3a (eGFR 45 to 59) and stage G3b (eGFR 30 to 44) CKD30. The effects of increasing dietary potassium intake on serum potassium levels in people with stage G3a kidney disease were derived from a randomized trial31 and extrapolated to people with stages G3b, G4 and G5 using data from a cohort study32. A meta-analysis of cohort studies was used to translate the effects on serum potassium levels into risks of cardiovascular death33.
Statistical analysis
Following the methods used in our prior work11 (Supplementary Text 2), we estimated the potential number of averted deaths, new cases and DALYs attributable to CVD and CKD resulting from a shift in SBP distribution due to changes in dietary sodium and potassium intake. For scenarios 1–3, we then also estimated the additional deaths from CVD caused by increased intake of potassium in individuals with CKD stages G3–5, and the net averted deaths were calculated for each simulation as the difference between the deaths averted by SBP lowering and the deaths caused by hyperkalaemia. We also estimated prevented deaths from CVD in individuals with CKD stages G3–5 alone. We summed up CKD stage-specific effects to derive the total additional deaths for all people with CKD stage G3–5 attributable to hyperkalaemia in each country-, age- and sex-specific group. For new cases and DALYs, we excluded inflammatory heart diseases (rheumatic heart disease, endocarditis and other cardiomyopathy) from the estimations as the risks of these conditions are largely independent of BP.
Uncertainty analysis
We quantified uncertainty in all analyses with probabilistic sensitivity analyses using n = 1,000 Monte Carlo simulations, jointly incorporating uncertainties in input parameters (Supplementary Text 3). We derived the corresponding central estimate for each endpoint (including benefits, harms and net effects) from the 50th percentile and the 95% UI from the 2.5th and 97.5th centiles of 1,000 modelling runs. We also conducted 13 deterministic sensitivity analyses by varying key input data (Supplementary Table 2). All analyses were performed using R version 4.2.3 and RStudio version 2025.09.1 Build 401. Libraries ‘tidyverse’, ‘dplyr’, ‘stringr’, ‘splitstackshape’, ‘doParallel’, ‘data.table’, ‘doRNG’, ‘arrow’, ‘sf’, ‘rnaturalearth’ and ‘rnaturalearthdata’ were used.
Reporting summary
Further information on research design is available in the Nature Research Reporting Summary linked to this article.
Source: www.nature.com